Guideline to the SmartVitiNet Training Portal!
- Oct 14, 2025
- 2 min read
Updated: Oct 29, 2025
The SmartVitiNet Training Portal is an advanced, user-friendly digital platform designed to support informed decision-making in viticulture.
Users can interact with the system through a web interface to send and receive data and information for their vineyards and areas of interest. Built with a focus on ethics, and sustainability, the SmartVitiNet portal ensures secure, near real-time access to actionable insights, driving innovation, productivity, and resilience in the European wine sector.
Special features:
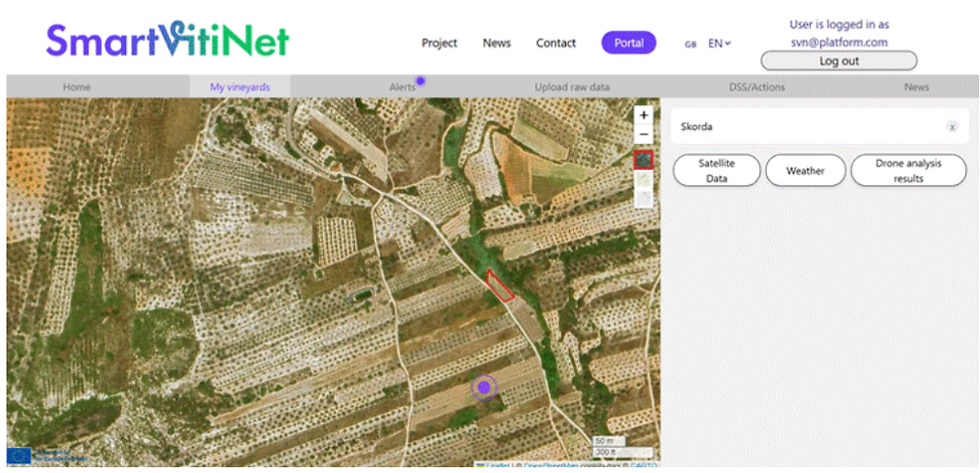
My Vineyards Map and List
Interactive world map displaying vineyard parcels (Portugal, France, Greece, Cyprus).
Vineyard list available in the right-hand panel.
Selecting a vineyard opens its detailed parcel view.


Satellite Indices
Available indices: Enhanced Vegetation Index (EVI), Moisture Stress Index (MSI), and Normalized Difference Vegetation Index (NDVI).
Features:
Parcel averages automatically calculated.
Filtering values by range.
Missing data coverage shown (e.g., due to cloud cover).
Temporal analysis with selectable dates or intervals.
Index-specific descriptions to guide interpretation.

Alerts and Notifications
Real-time alerts for water stress, disease risk, and data quality.
Configurable thresholds trigger messages such as “High water stress detected.”
Alerts include vineyard parcel, date, and recommended action.

Weather Station Integration
Live feed from vineyard weather stations.
Displays current readings: temperature, humidity, rainfall, wind.
Battery status of devices monitored to prevent data loss.
Map markers show the exact location of stations.


Drone Data Upload and Analytics
Workflow:
Users upload drone imagery (RGB, multispectral).
Metadata entry (vineyard ID, acquisition date).
System processes and validates data.
Results include:
Water Stress Analysis: maps highlighting stressed areas in red.
Disease Analysis: detection of potential disease zones.
Outputs presented as interactive parcel maps with point-level coordinates.
Below images show an example of drone data upload and visualisation


Check out the Training Portal now!
Stay connected with SmartVitiNet and never miss an update! Subscribe to our newsletter for the latest news, insights, and advancements in sustainable viticulture. For real-time updates and engaging discussions, follow us on LinkedIn, Bluesky, and X. Join our growing community and be part of the conversation shaping the future of viticulture.


Comments